
Thurston Economic Vitality Index
Winter 2021 Update
Thank you to our EVI supporters

South Puget Sound Community College is proud to work with local partners like the Thurston Economic Development Council and the Center for Business and Innovation. Our institution believes in the power of regional transformation through deep collaboration and strong partnerships. We are committed to ensuring a prosperous and sustainable economy for all people in Thurston County. Our academic programming is designed to help students succeed in our ever-changing world, and partnerships like ours with the Thurston EDC help to insure our community stays vibrant and responsive to those changes.
![]()
In a changing local economy our economic development partners become a critical asset to our regional health. That’s why the Port of Olympia is proud to support the Thurston Economic Development Council and their mission to build a prosperous economy for all Thurston County residents. The Port of Olympia is committed to supporting the outcomes of Thurston County residents by working directly with our community partners to tackle the issues that our time has presented to us. The Port of Olympia is ready to meet the moment and we know that our community’s best days lie ahead of us.
This update provides an overview of economic conditions for Thurston County, Washington. The report includes the Thurston EVI Leading Indicators Index and Thurston EDC Business Confidence Index. In addition, the UM Consumer Sentiment Index is provided to serve as a proxy for Thurston County household perceptions of the local economy. Overall, conditions continue to improve as the local economy is steadily returning to pre-COVID levels.
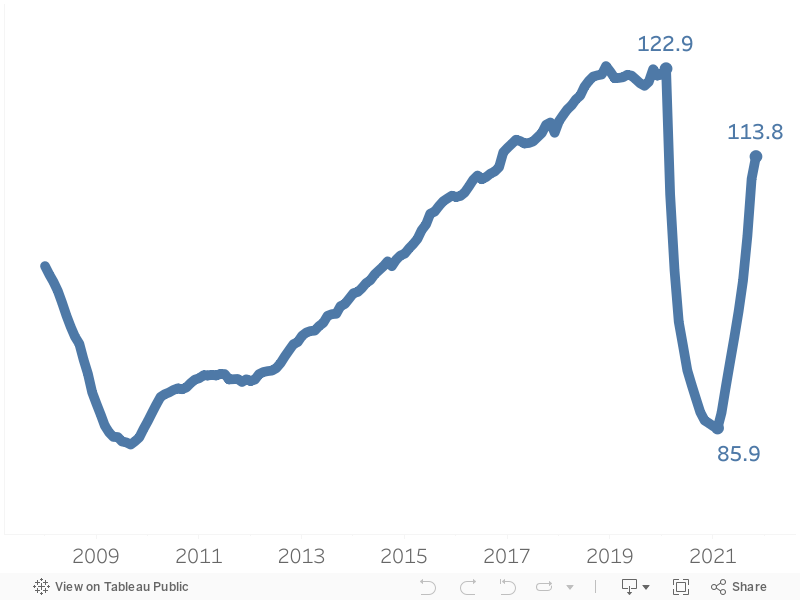
THURSTON EDC EVI LEADING INDICATOR INDEX – This composite leading index for Thurston County is based on five monthly published indicators deemed to be good measures and proxies for Thurston County.[1] A leading index represents conditions that are likely to occur in the near future. Thus the index can serve as a possible planning tool for businesses and policy makers. The index currently implies that conditions for Thurston County’s economy are very favorable with the index projected to continue an upward trend into the near future. As can be seen in Figure 1 below, the index currently stands at 114 which is up from 86 at the beginning of the year.
Figure 1. Thurston EVI – Leading Indicators Index (2008-2021).
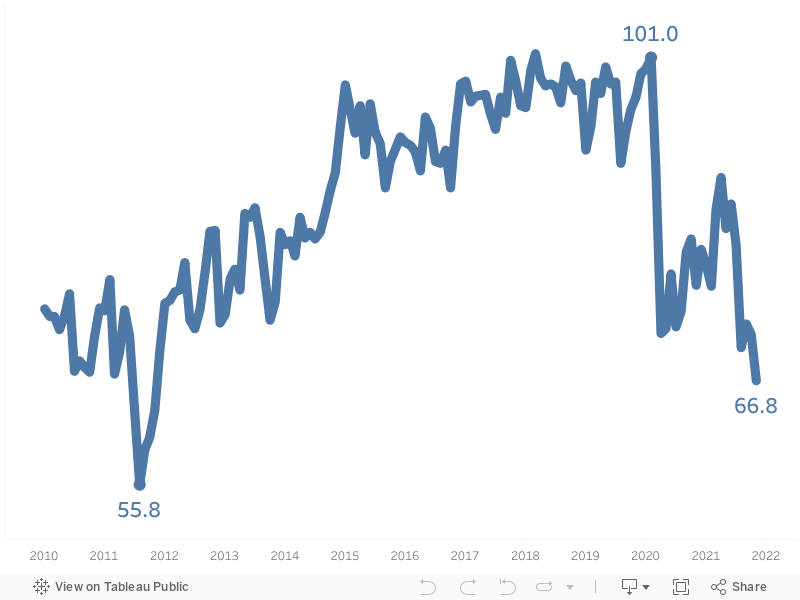
THURSTON EDC BUSINESS CONFIDENCE INDEX – The Thurston EDC Business Confidence Index[2] represents the perceptions of business owners in Thurston County. Their perceptions of local business and economic conditions provide insights into the supply side of the economic equation. Their access to detailed information on new orders, inventory, customers, prices, suppliers and what kind of financing is available to businesses serves as a good leading indicator for Thurston County’s economy. As can be seen in Figure 2 below, the index currently stands at 64. While this is down six points from Q2 2021, the index however is still 22 points above its all-time low of 42 only a little over a year ago. Thus there is still strong positive perceptions and optimism of local conditions. Any reading of more than 50 points reflects more positive than negative responses.
Figure 2. Thurston EDC Business Confidence Index (2010-2021)
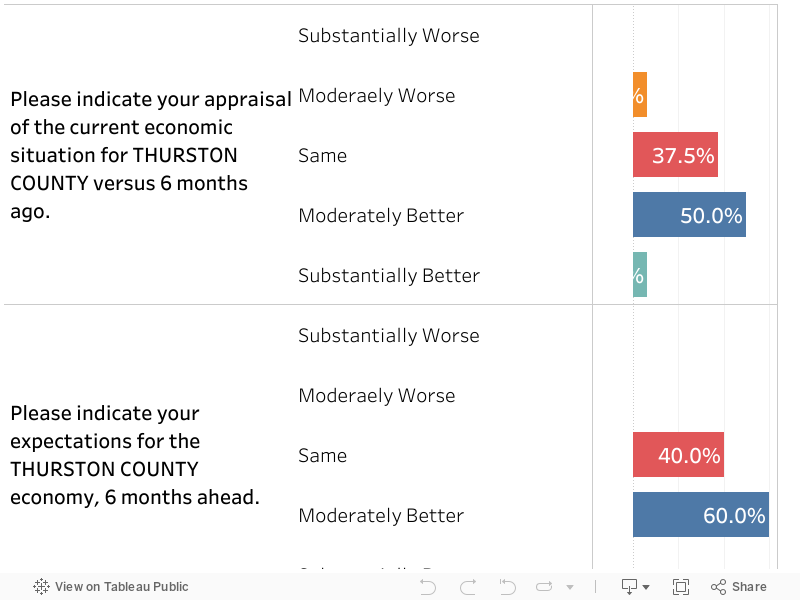
As can be seen in Figure 3 below, when Thurston business leaders were asked about their overall perceptions of local economic conditions compared to six months ago, 50 percent responded that conditions were moderately better and 38 stated that conditions where the same. When questioned about their perceptions of conditions in their own industry, compared to six months ago, 56 percent stated that they felt conditions were moderately better. However when asked about their perceptions near future conditions for their own industries, along with profit expectation, 56 percent indicated that they felt things would be the same. It should be pointed out that none of the respondents felt that conditions or profits would be worse.
Figure 3. Responses to individual questions, Thurston EDC Business Confidence Survey, Q4 2021.
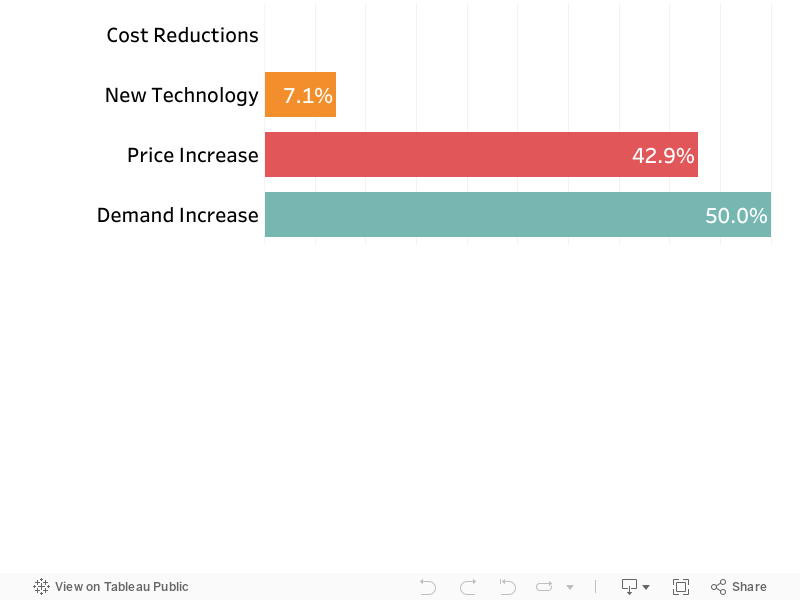
Respondents were then asked that if profits were expected over the next twelve months, what they anticipated would be the main drivers. As can be seen in Figure 4 below, the predominant response was an increase in market demand and growth at 50 percent. It is interesting to note that only 43 percent felt they would need to raise their prices likely due to inflationary concerns that have been discussed in the media over the last few months.
Figure 4. Source of profits, if expected, Thurston EDC Business Survey, Q4 2021.
CONSUMER SENTIMENT – Consumer and household expenditures are a major driver of economic growth at both the local and national level. The University of Michigan (UM) conducts a national survey of consumer sentiment every month and Figure 5 below shows the index values since January 2010.
The Thurston EDC has conducted a local consumer confidence survey in the past and it has closely mirrored the UM survey. Changes in household reliance on landlines, and a strong trend towards cellular phones, have made the local efforts more difficult and costly and thus the UM index is used as a proxy at this point, again given how closely it has mirrored local conditions in the past.
As can be noted, the UM index now stands at 67 for November 2021 which is down from its per-COVID high of 101. This drop likely can be explained by the extensive coverage on possible impacts of inflation and that COVID-19 continues to be a threat.
Figure 5. UM Index of Consumer Sentiment (2008-2021).
CONCLUSIONS – In summary, conditions for Thurston County remain overall positive and are projected to continue upward to pre-COVID territory. The Thurston EDC EVI Leading Composite Index currently stands at 114 which is a 28 point increase over where it stood just a little less a year ago at its recent low point of 86 points.
Further, local business leaders continue to remain overall optimistic about the state of the local economy with the Thurston EDC Business Confidence Index currently at 64. Again, any number over 50 reflects the fact that there were more positive than negative responses on perceptions of the state of the local economy and their particular industries. Business leader responses to individual survey questions fell mostly in the moderately better to same categories. Further, for those that expected profits, over the next year, 50 percent stated that growing local demand would be the main driver while 43 percent felt that they would need to raise prices. This again is likely the result of extensive coverage about supply chain disruptions and inflationary pressures. These factors are also likely the causal variables behind the UM Consumer Sentiment Index dropping to 67 points.
It should be noted that Thurston County house values continue to surge, along with it large middle class household saving rates, both enabling more purchasing power to address any pent-up demand. Consumer spending nationally on tangibles has continued to increase. Further, as more headway is made on reducing COVID’s impact, it is forecasted that expenditures on services will continue to rebound as well.
New fiscal stimulus, such as the passing of the recent infrastructure bill, should also have a positive impact on Thurston County with its large public sector component, as the seat of Washington State’s government. Further, continued private sector investments in the county by global corporations, such as Amazon, all bode well for the county’s continued upward economic growth and positive trends going forward into next year.
[1] The indicators include total residential building permits, initial unemployment claims, consumer sentiment, U.S. securities yield spreads, and equity financial instruments deemed to impact the local economy.
[2] Results are based on the Thurston EDC’s recent email-based ‘expert survey’ of Thurston leaders conducted by Gene Angel, Director of Research and Evaluation for the Thurston EDC. A total of 82 participants were included in the survey representing the Thurston EDC, local chambers, and other entities and a variety of industries reflective of the Thurston County economy. The results are based on 16 completed questionnaires resulting in a 20 percent response rate.
Your Economic Development Council’s 2020 Total Economic Impact
Median Household Income
The graph below shows changes in household level income between years 1989 to 2020 for Washington State and the Counties of King, Thurston, Pierce, Pacific, Grays Harbor and Lewis.
Figure 6: Median Household Income Select Geographies (Inflation Adjusted), 1989-2020
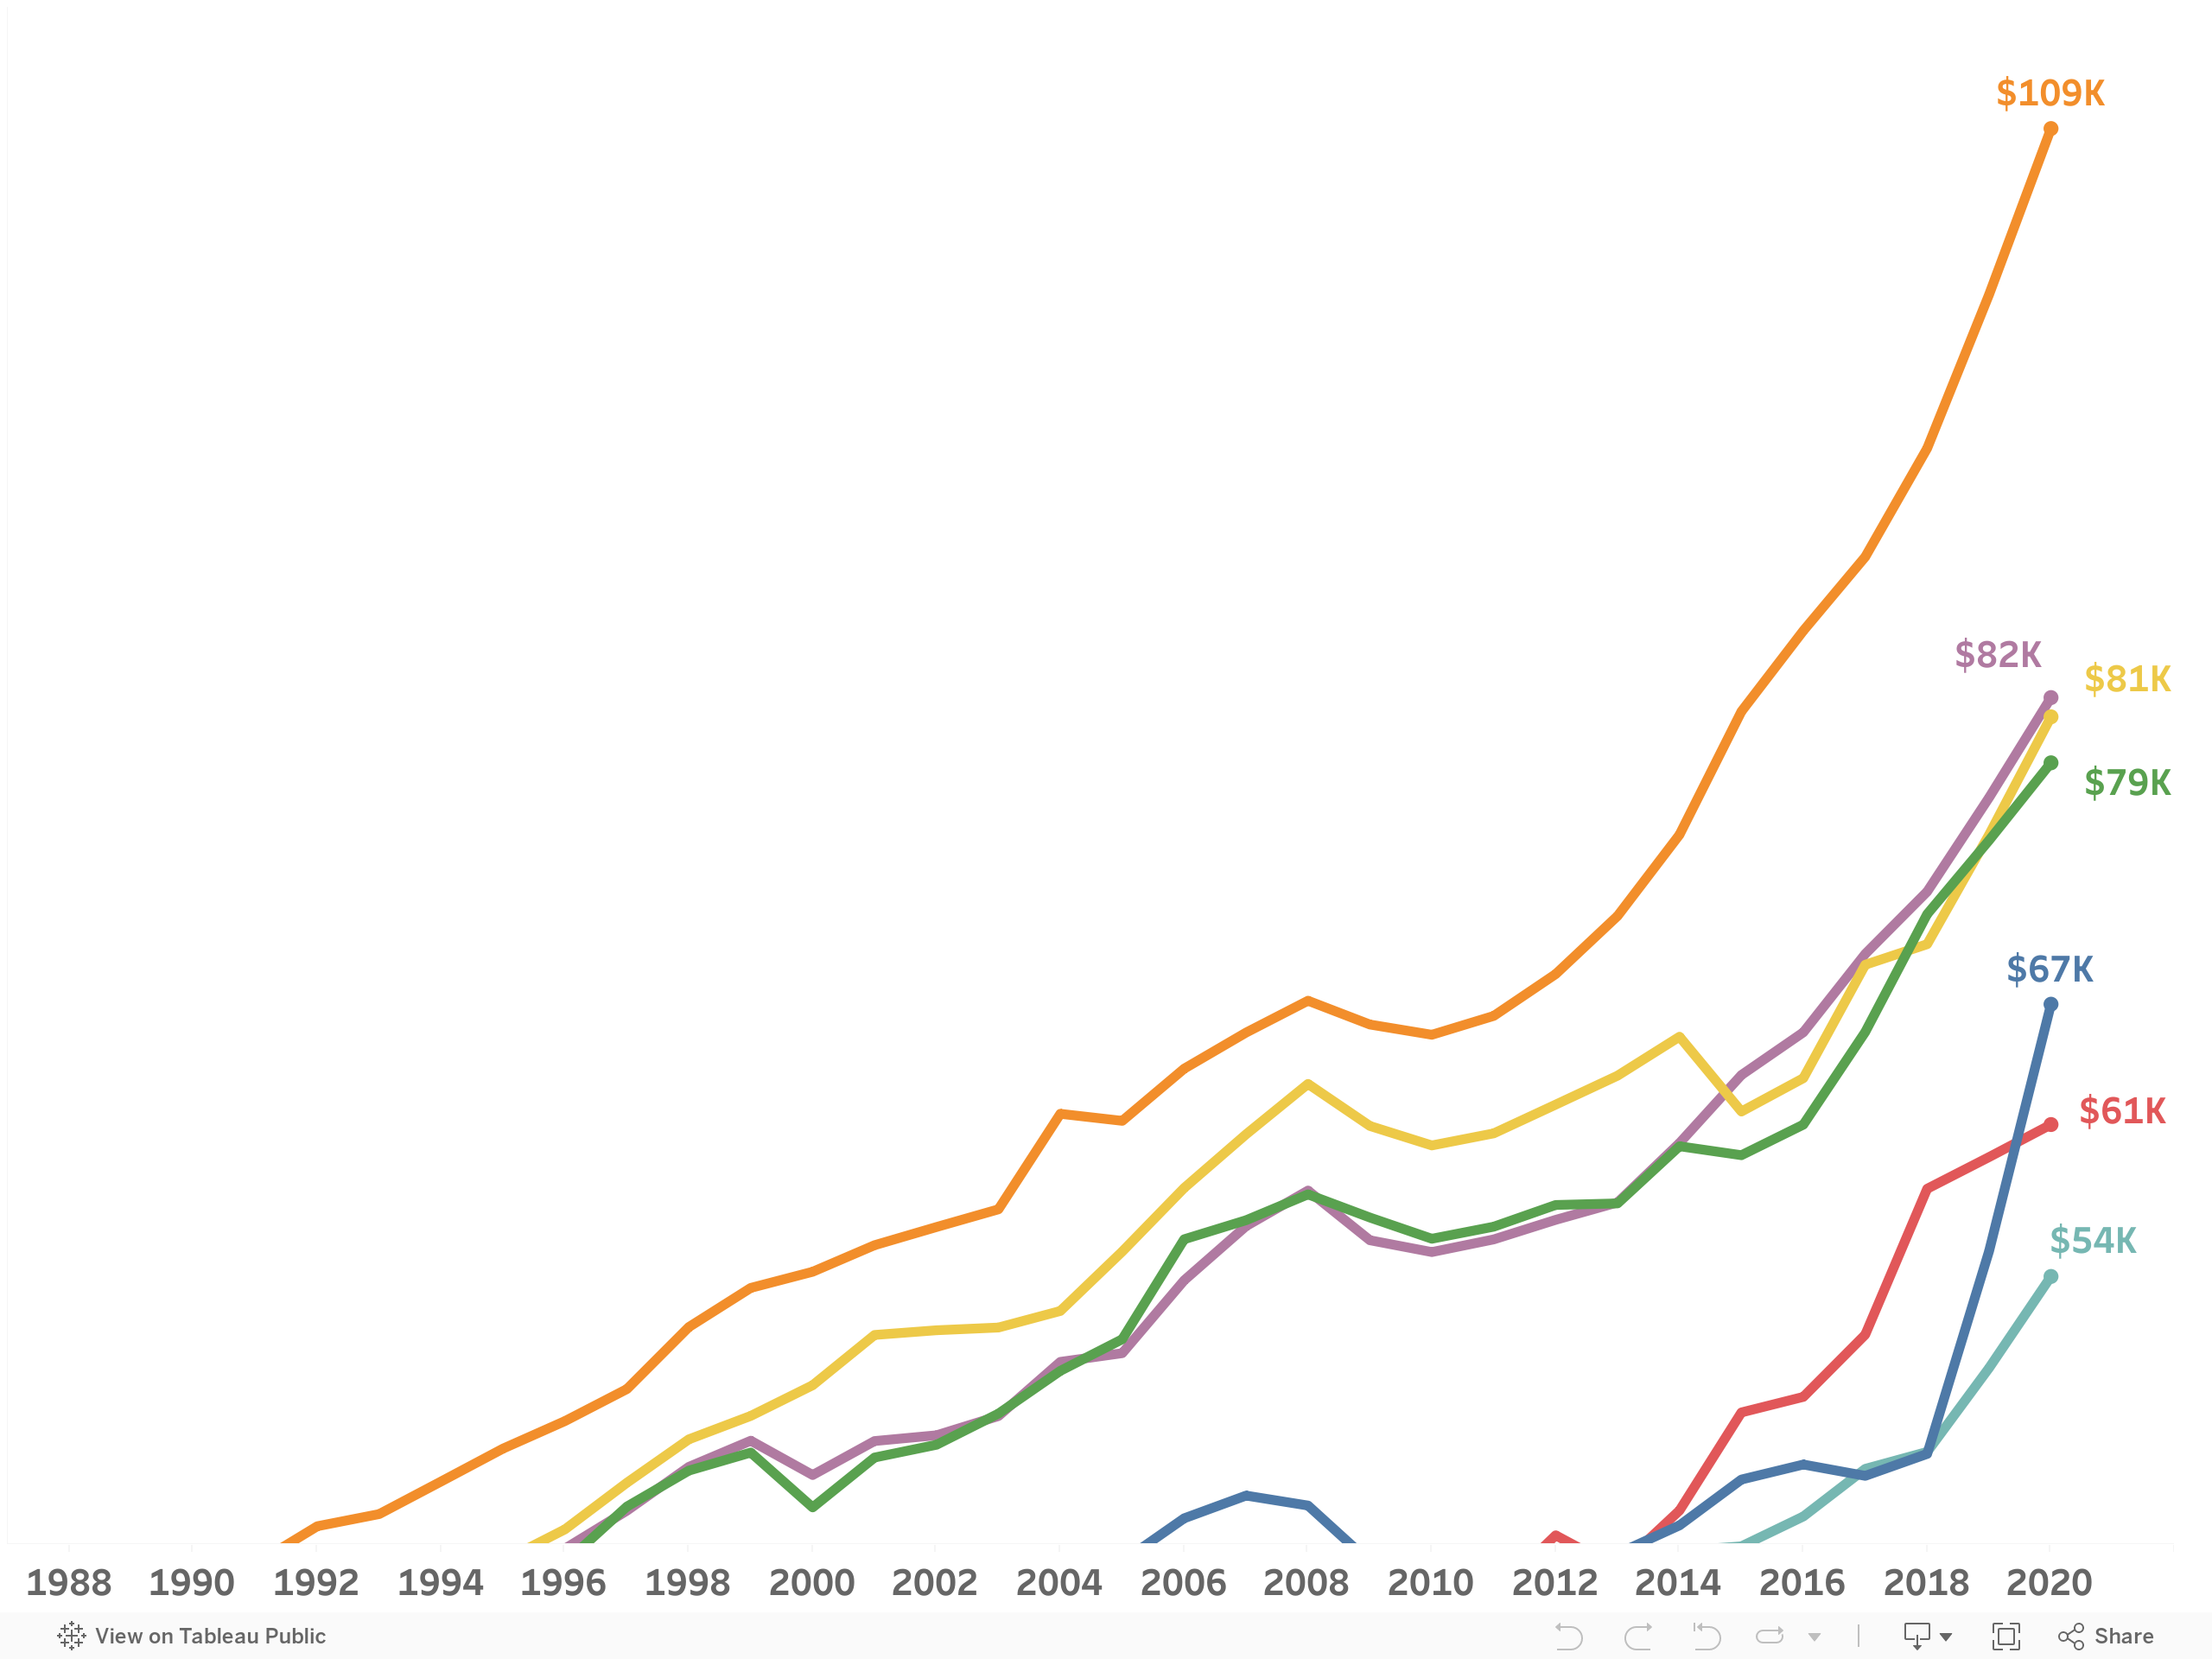
Source: Thurston Regional Planning Council and Washington State Department of Revenue
Housing Affordability
The index below comes from the Washington Center for Real Estate Research at the University of Washington and measures housing affordability for both middle-income earners and first-time homebuyers within Washington State and Thurston County. A value of “100” on the index below means that home prices and worker salaries are in parity. A value above 100 would indicate that housing remains affordable and a value below 100 would indicate that housing is not affordable when compared to worker salaries.
The cost of housing in Thurston County and Washington State has continued (and accelerated) its trend towards a less affordable marketplace for both middle income and first-time homebuyers.
For Middle Income workers Thurston County still remains an affordable community to live and work in though the trend line continues to move towards less and less affordable community. For Washington State as a whole, the trend of unaffordability has accelerated deeper than here in Thurston County.
First-time homebuyers in both Thurston County and Washington State have seen deep and sudden price increases in the last year. These price increases have accelerated the unaffordability trend and made homeownership exceptionally difficult for first-time purchasers in both Thurston County and Washington State as a whole.
While Thurston County was already trending towards an unaffordable housing market for its local workforce, increases in demand caused by low Fed rates and pandemic driven work from home policies have supercharged the market and pushed prices even higher.
Figure 7: Housing Affordability Index – Middle Income Earners, 2005-2021
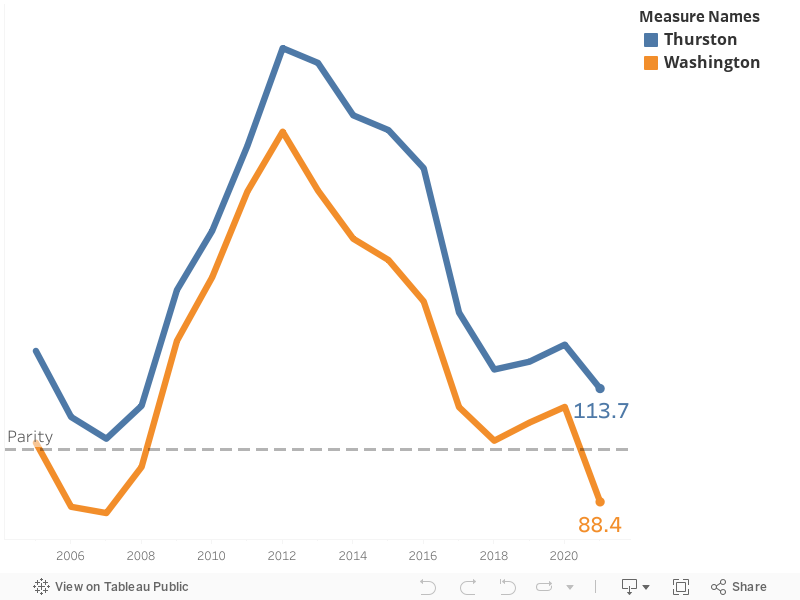
Source: Washington Center for Real Estate Research at the University of Washington
Figure 8: Housing Affordability Index – First-time Homebuyers, 2005-2021
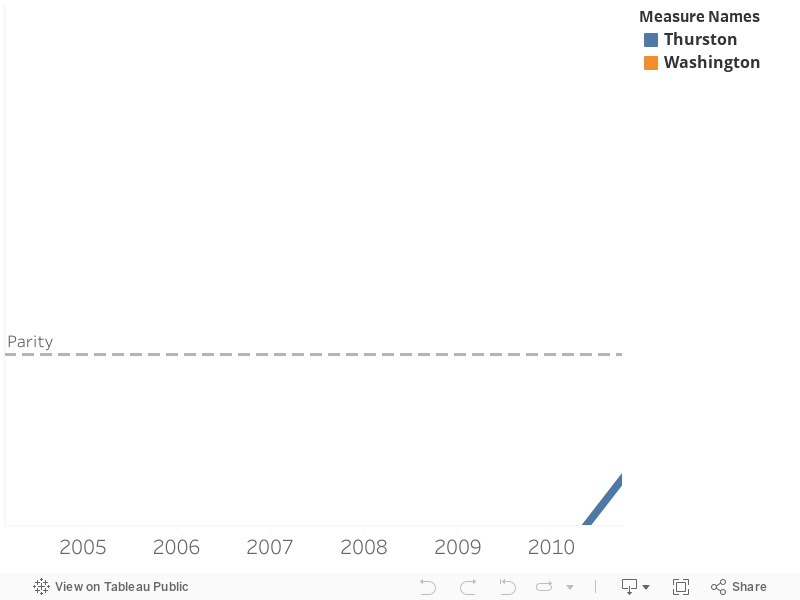
Source: Washington Center for Real Estate Research at the University of Washington
Employment growth within targeted industries remained flat or contracted during 2020. This contraction is attributed to disruption caused by the Covid-19 pandemic and is largely transitionary as our community moves into a phase of economic recovery through 2021 and 2022.
Industry sectors Agriculture, Manufacturing, and Professional Services showed mostly flat movement through the Pandemic while Information, Healthcare, Arts/Entertainment and Accommodation/Food Services saw declines. The most impacted (by percentage) tracked industry sector was Accommodation/Food Service which shed approximately 1,600 full-time jobs during the 2020 pandemic.
Figure 9: Target Industry Employment Change, 2014-2020
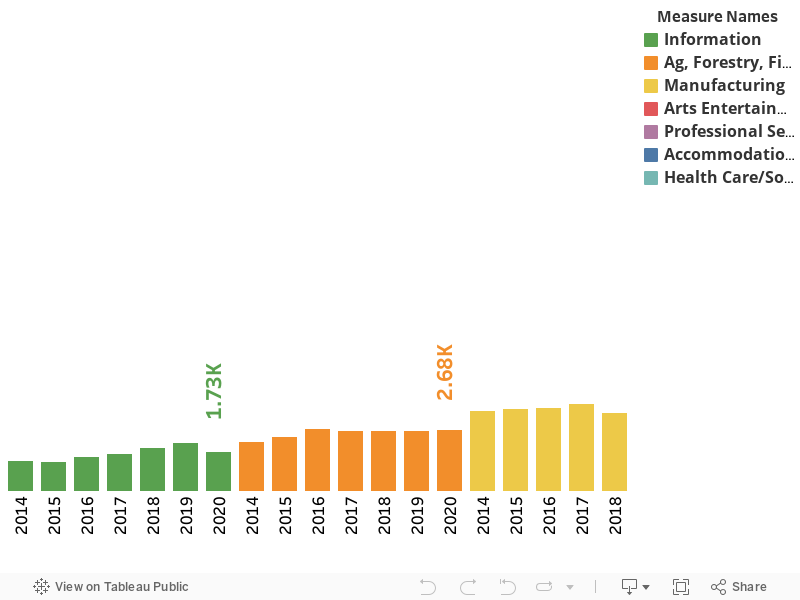
Source: JobsEQ
Unemployment
Unemployment peaked in Thurston County at approximately 13% which was consistent with the Washington State average, but has rapidly recovered in 2020. Currently the Thurston County unemployment rate sits at 6% and is continuing the trend back to pre-pandemic levels of employment.
Figure 10: Unemployment Change, 1989-2020
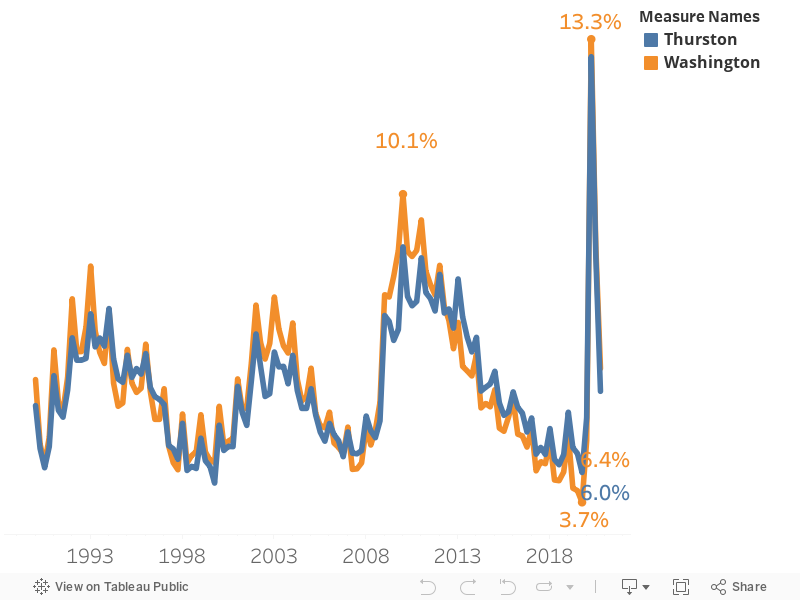
Source: JobsEQ
Taxable Retail Sales
As an economy grows so does the taxable revenues for public sector service providers. Taxable retail sales for all jurisdictions in Thurston County have continued to grow or remain relatively flat throughout the pandemic. When adjusted for population, per capita taxable sales isolate economic effects away from general population growth. For the first time since the EVI began tracking information, the City of Tumwater has generated the highest per capita taxable sales amount in Thurston County at $47,000 per resident. This increase for Tumwater is largely attributable to pandemic driven sales at big box stores, increases in automotive sales and a relatively flat population growth. It is expected that these surges are temporary and that Olympia is likely to regain the top spot next year.
Figure 11: Total Taxable Retail Sales by Jurisdiction (Inflation Adjusted), 1993-2020
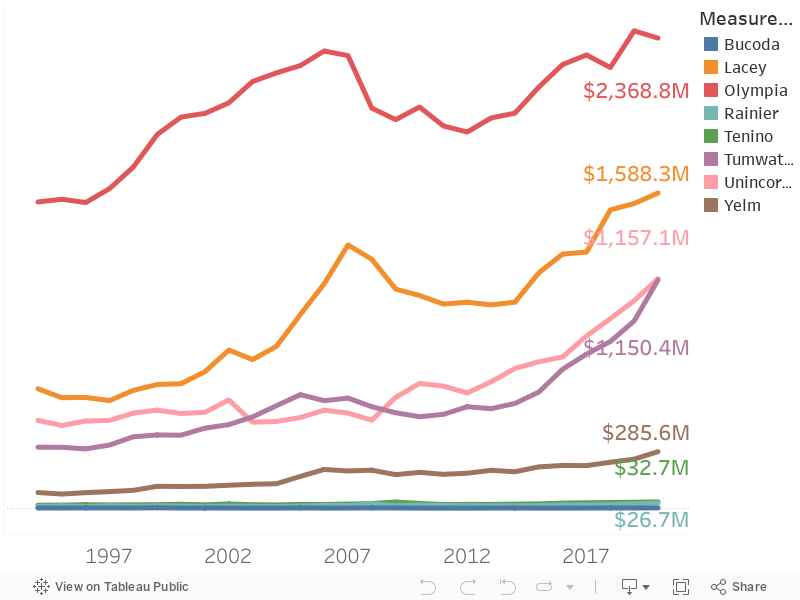
Source: Thurston Regional Planning Council & WA Department of Revenue
Figure 12: Per Capita Retail Sales by Jurisdiction (Inflation Adjusted), 1994-2020
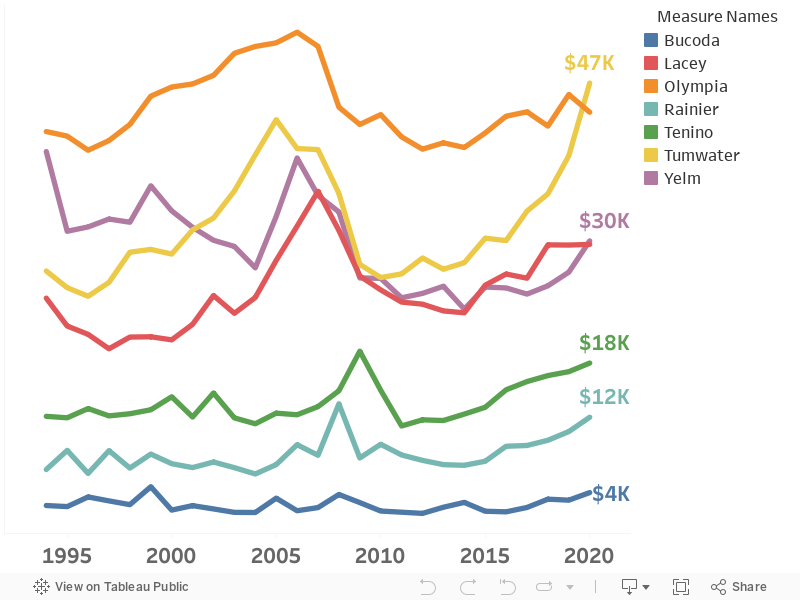
Source: Thurston Regional Planning Council & WA Department of Revenue
GDP and Compensation
Both GDP and compensation were impacted in Thurston County by the COVID-19 pandemic, but as the local recovery continues to solidify in our region it is expected that growth will continue on during the next year. As of 2020, the standing GDP was valued at $14.4Bm and compensation at $8.6B within Thurston County.
Figure 13: Total GDP & Compensation by Geography, 2001-2020
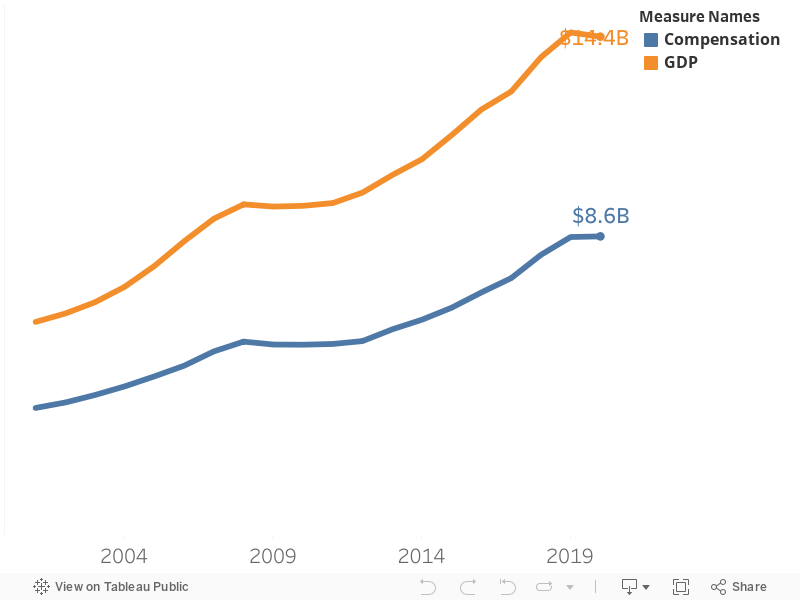
Source: JobsEQ
Industry GDP
While private sector growth has slowed during the pandemic, Thurston County has continued to benefit from a robust public sector employment base. The largest industry sector represented by output is Public Administration valued at $3.2B. The next largest sector by output is Real Estate at $1.6B followed closely by Healthcare at $1.5B.
Figure 13: Top 10 Industry Sectors by Output, 2020
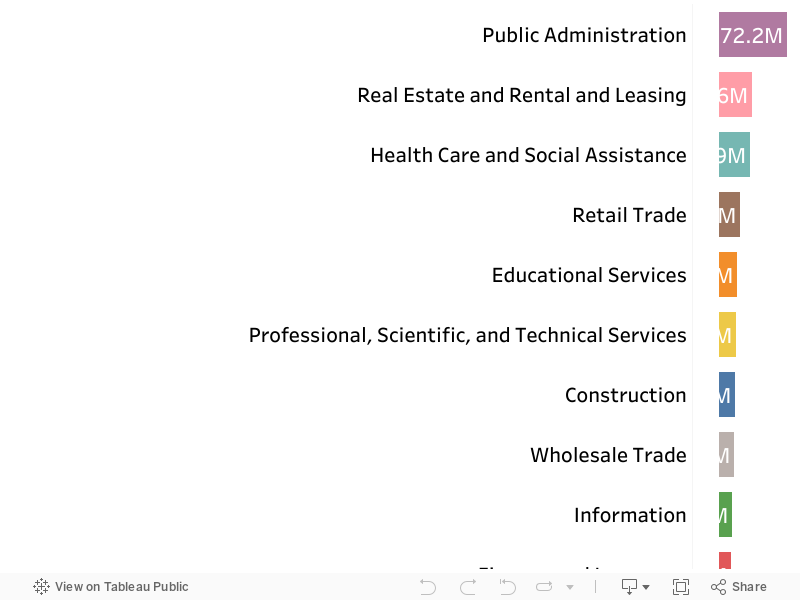
Source: JobsEQ